par Dateline Resources Limited (NASDAQ:DTREF)
Colosseum Bankable Feasibility Study Confirms High Margin Gold Project
A Technically Simple Restart with Strong Economics
SAN BERNARDINO, CA / ACCESS Newswire / May 11, 2026 / Dateline Resources Limited (ASX:DTR)(OTCQB:DTREF)(FSE:YE1) (Dateline or the Company) is pleased to present the results of the Bankable Feasibility Study (BFS) for the 100%-owned Colosseum Gold and Rare Earth Element (REE) Project in San Bernardino County, California. The BFS demonstrates a robust gold development, generating significant margins.
Highlights
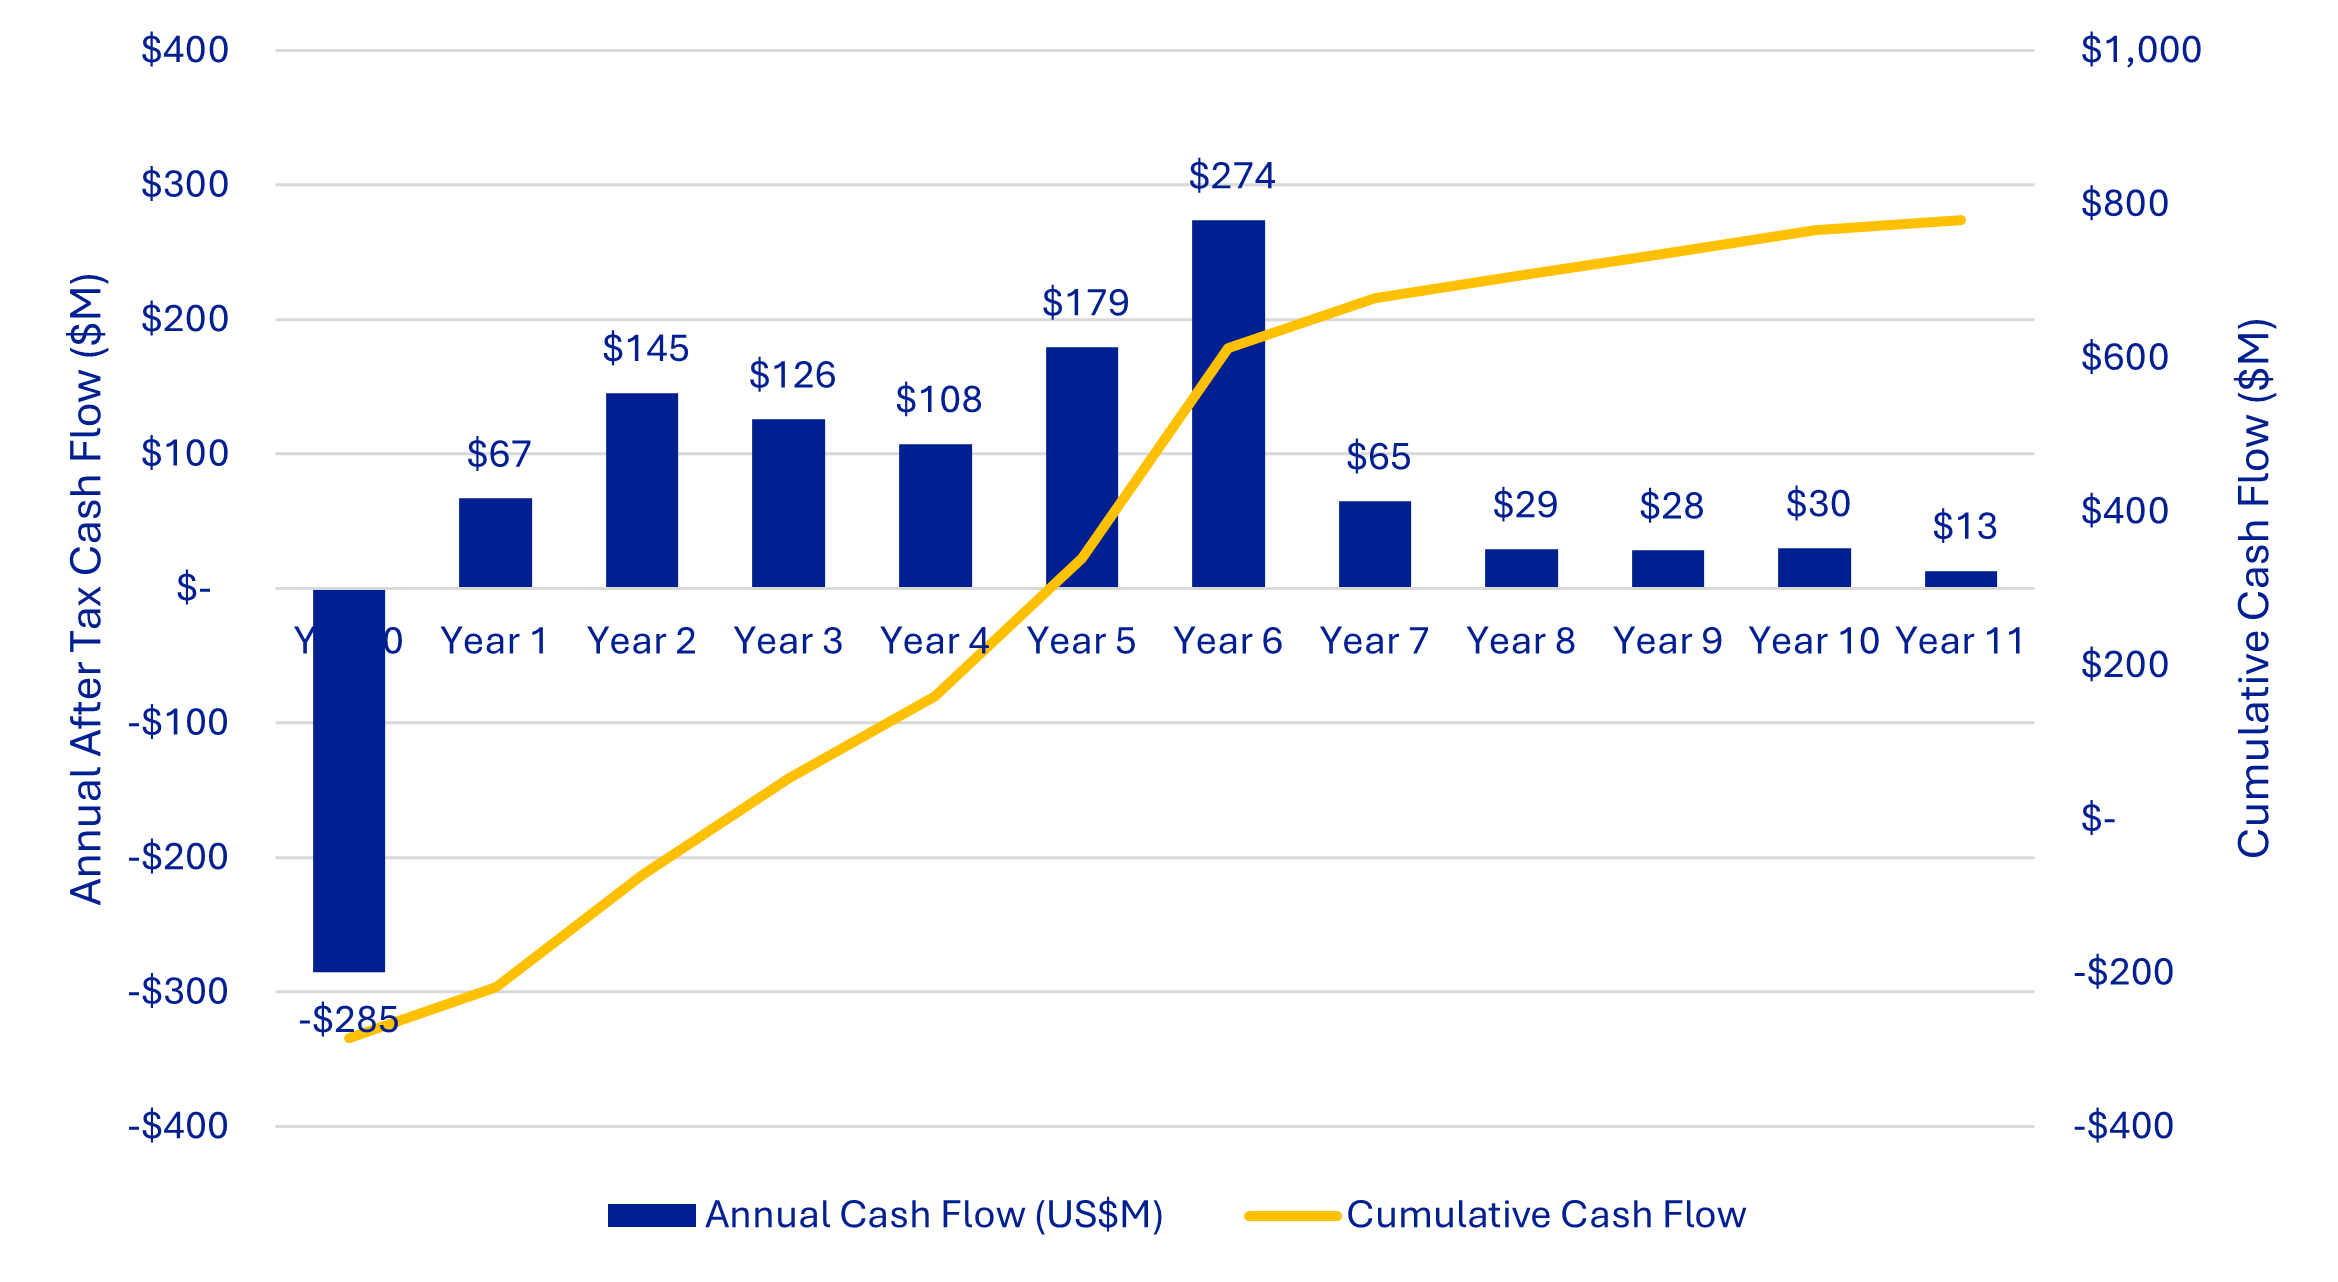
US$1.08B undiscounted pre-tax free cashflow
Increases to US$1.357B using spot price
US$785M NPV5% (pre-tax)
Increases to US$999M using spot price
49.5%IRR (pre-tax) at base model gold price (US$4,200/oz),
Increases to 59.5% using spot price (US$4,700/oz)
US$249M of start-up capital (including US$16M of capitalised mining) plus US$25M contingency.
75koz average annual gold production of over first 6 years.
573koz total gold production over 10.4 year mine life
102koz peak gold sales of in year 6.
~$55M increase in undiscounted pre-tax free cashflow for every $100/oz increase in gold price
US$1,825/oz All-in Sustaining Cost (AISC) based on current industry costs within ±15%.
Low 3:1 strip ratio highlights Colosseum's strong mining efficiency, with reduced waste movement supporting lower operating costs.
55koz of Inferred Mineral Resources within the pit shell that have not been included in the Ore Reserve.
Additional underground potential in the northeast of the North Pit, that is open at depth and subject to ongoing drilling not included in Ore Reserve, including recently drilled holes.
Dateline's Managing Director, Stephen Baghdadi, commented:
"Since acquiring Colosseum in 2021, we have recognised the significant potential of the project. The near vertical nature of mineralisation associated with the breccia pipes demonstrates excellent continuity that continues with depth. Since the original Scoping Study was completed in October 2024, we have continued to see strength in the gold sector, with the project forecast to generate operating margins of greater than $2,500 per ounce.
"With the BFS complete and the Front-End Engineering Studies (FEED) well underway, our engagement with project financiers is advancing as we look to secure the funding required to commence production as soon as possible."
Financial Metrics
Operating and capital cost estimates in the Study are based on current industry costs and are considered to be accurate within ±15%.
Spot Gold Price (US$4,700/oz)
Undiscounted free cash flow of $1,357M pre-tax and $978M post-tax.
NPV5% of $999M pre-tax and $704M post-tax.
IRR of 59.5% pre-tax and 46.2% post-tax.
All-in Sustaining Cost (AISC) of $1,838/oz.
Base Gold Price (US$4,200/oz)
Undiscounted free cash flow of $1,082M pre-tax and $779M post-tax.
NPV5% of $785M pre-tax and $551M post-tax.
IRR of 49.5% pre-tax and 38.6% post-tax.
All-in Sustaining Cost (AISC) of $1,825/oz.
Gold Price Sensitivity
Every $100/oz increase in gold price, increases undiscounted pre-tax free cash flow by ~$55M.
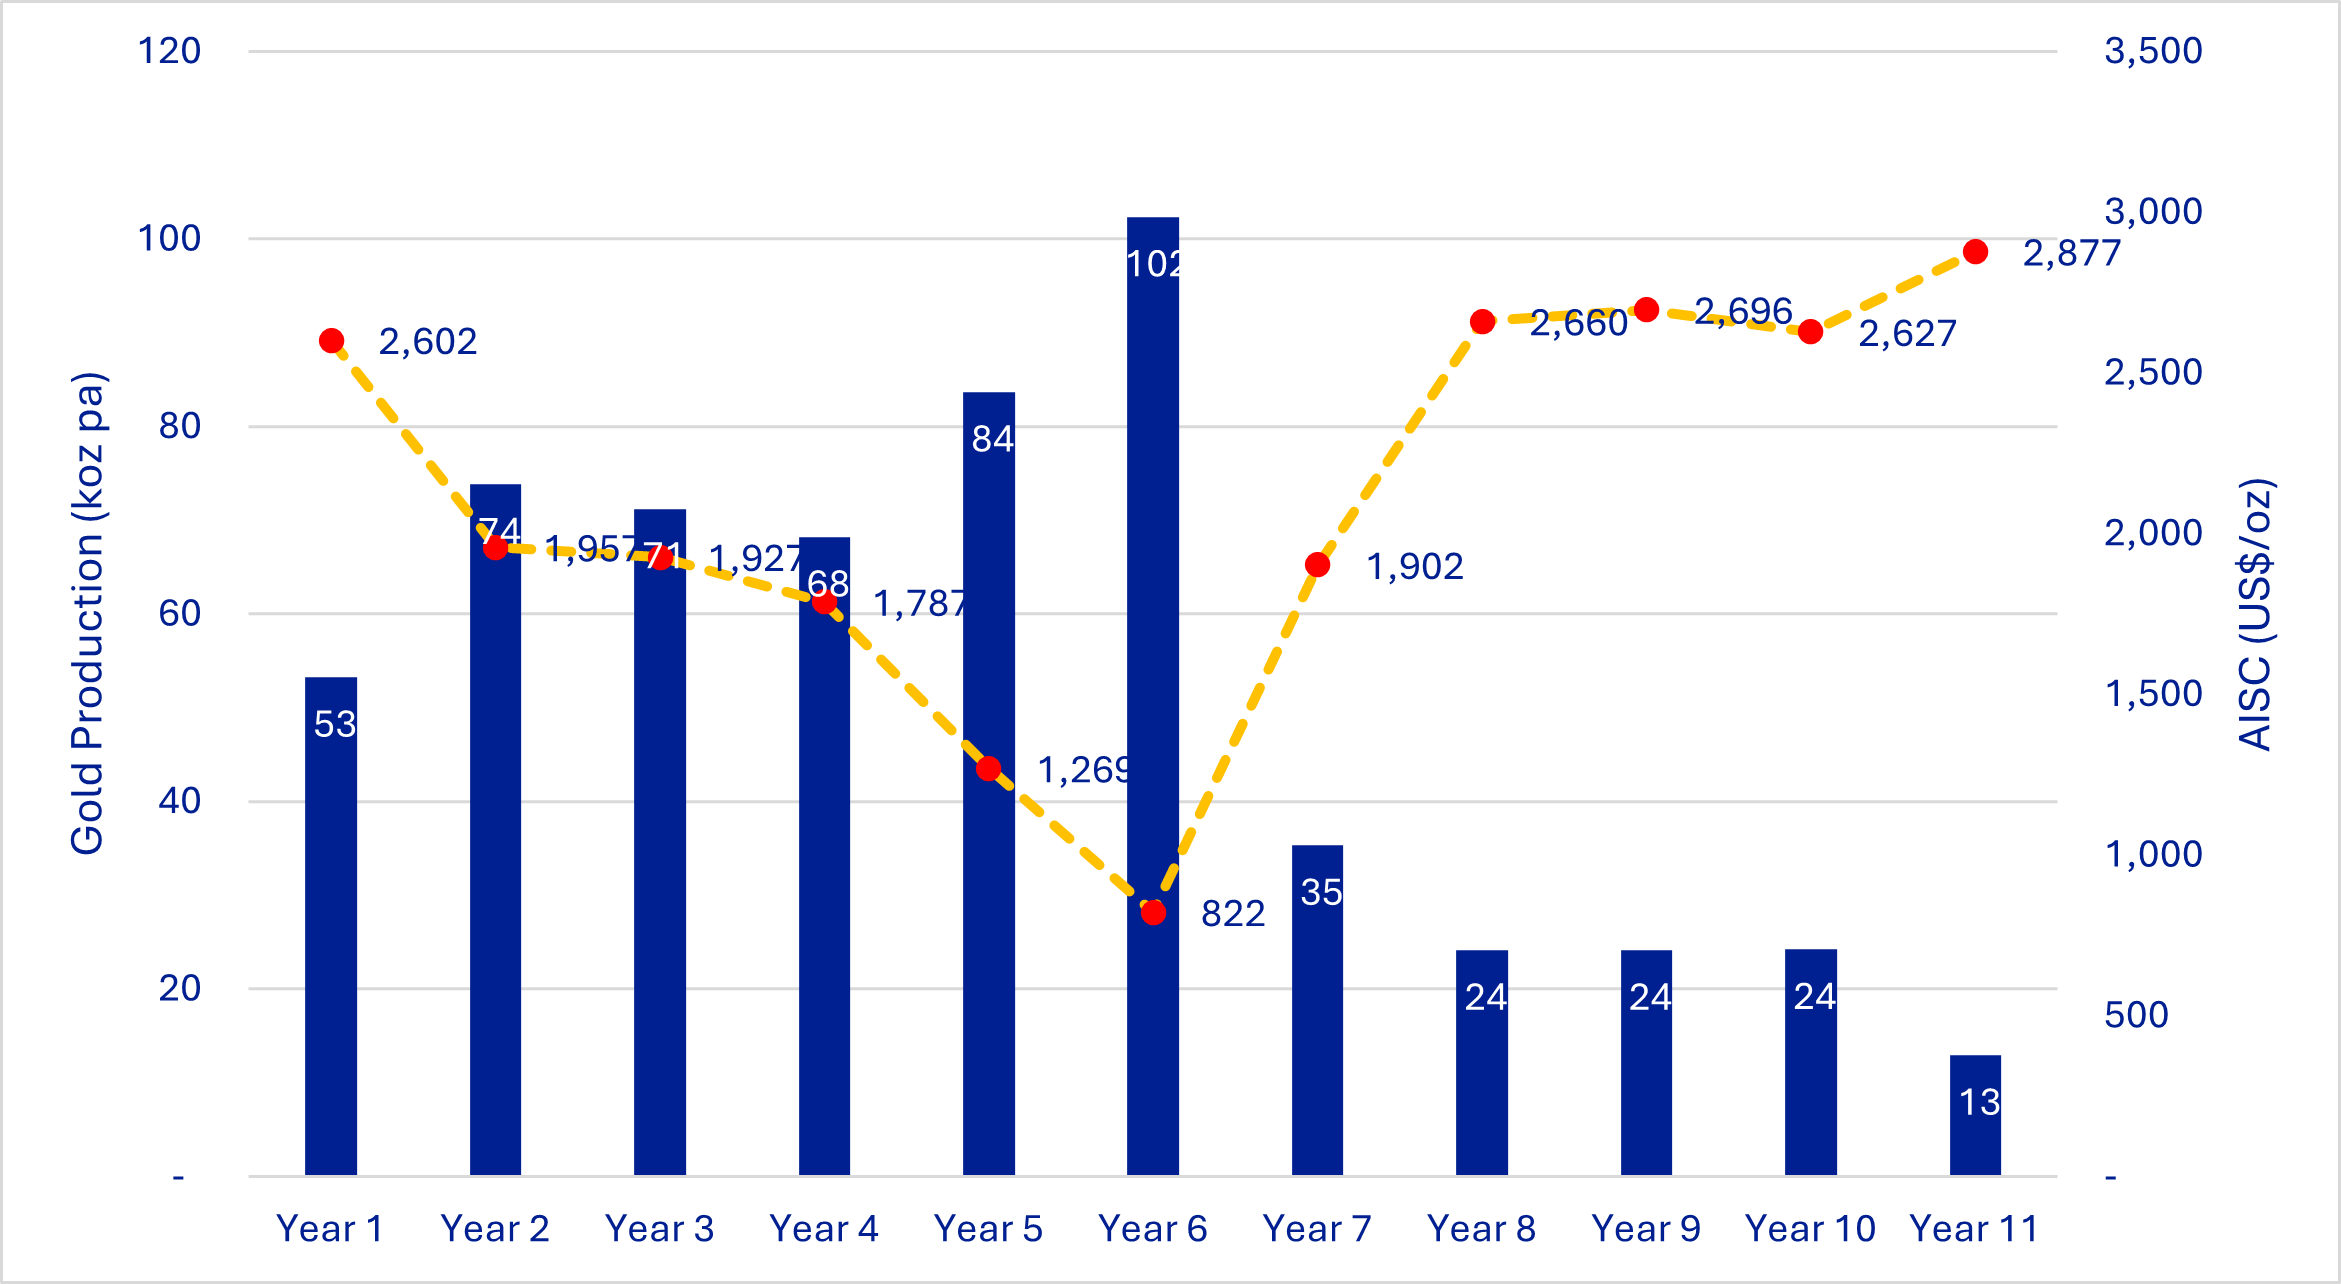
Gold Production Profile
Total gold production of 573koz.
Peak annual gold production of 102koz in year 6.
Average annual gold production of 75koz over first 6 years, before transitioning to stockpile processing.
Mining and Processing - Mining is front loaded in first six years
2Mtpa carbon-in-leach (CIL) processing plant
Metallurgical recovery averages 91% over life of mine
100% of ore (20.6 tonnes of ore at 0.95g/t Au) mined in first six years
11.5Mt at 1.34g/t Au processed during first six years, producing 497koz
Stockpiled material, already mined, will be processed over the next 4.4 years, producing a further 133koz
Table 1:Key Study Metrics
Unit | May 2025 Scoping Study | 2026 Bankable Feasibility Study | ||
Base Case | Spot Price | |||
Gold Price | $/oz | 2,900 | 4,200 | 4,700 |
PRODUCTION TARGET | ||||
Life of Mine | Years | 8.3 | 10.4 | 10.4 |
Total Ore Mined | M Tonnes | 16.6 | 20.6 | 20.6 |
Total Waste Mined | M Tonnes | 56.8 | 62.2 | 62.2 |
Total Material Movement | M Tonnes | 73.3 | 82.9 | 82.9 |
Strip Ratio | x:x | 3.4:1 | 3.0:1 | 3.0:1 |
Total Tonnes Milled | M Tonnes | 16.6 | 20.6 | 20.6 |
Average Plant Throughput | Mtpa | 1.8 | 2.0 | 2.0 |
Average Head Grade | g/t Au | 1.3 | 0.95 | 0.95 |
Average Recovery | % | 92 | 91 | 91 |
Total Net Gold Produced | koz | 635 | 573 | 573 |
Ave Annual Gold Production (first 6 years) | Koz pa | 71 | 75.4 | 75.4 |
FINANCIALS | ||||
Total Operating Costs | $M | 751 | 942 | 942 |
Total Capital Costs | $M | 195 | 313 | 313 |
Pre-Production Capex | $M | 138 | 249 | 249 |
Total Pre-production capital expenditure and working capital requirements | $M | 153 | 275 | 275 |
Net Revenue | $M | 827 | 779 | 978 |
Total Sales Revenue (including royalties) | $M | 1,773 | 2,337 | 2,612 |
Discount Rate | % | 6.5 | 5 | 5 |
Pre-Tax Discounted Cashflow - NPV | $M | 550 | 785 | 999 |
Pre-Tax Internal Rate of Return (IRR) | % | 61 | 49.5 | 59.5% |
UNIT COSTS | ||||
Unit Operating Costs (C1) | $/oz | 1,182 | 1,651 | 1,663 |
All-in Sustaining Costs | $/oz | 1,490 | 1,825 | 1,838 |
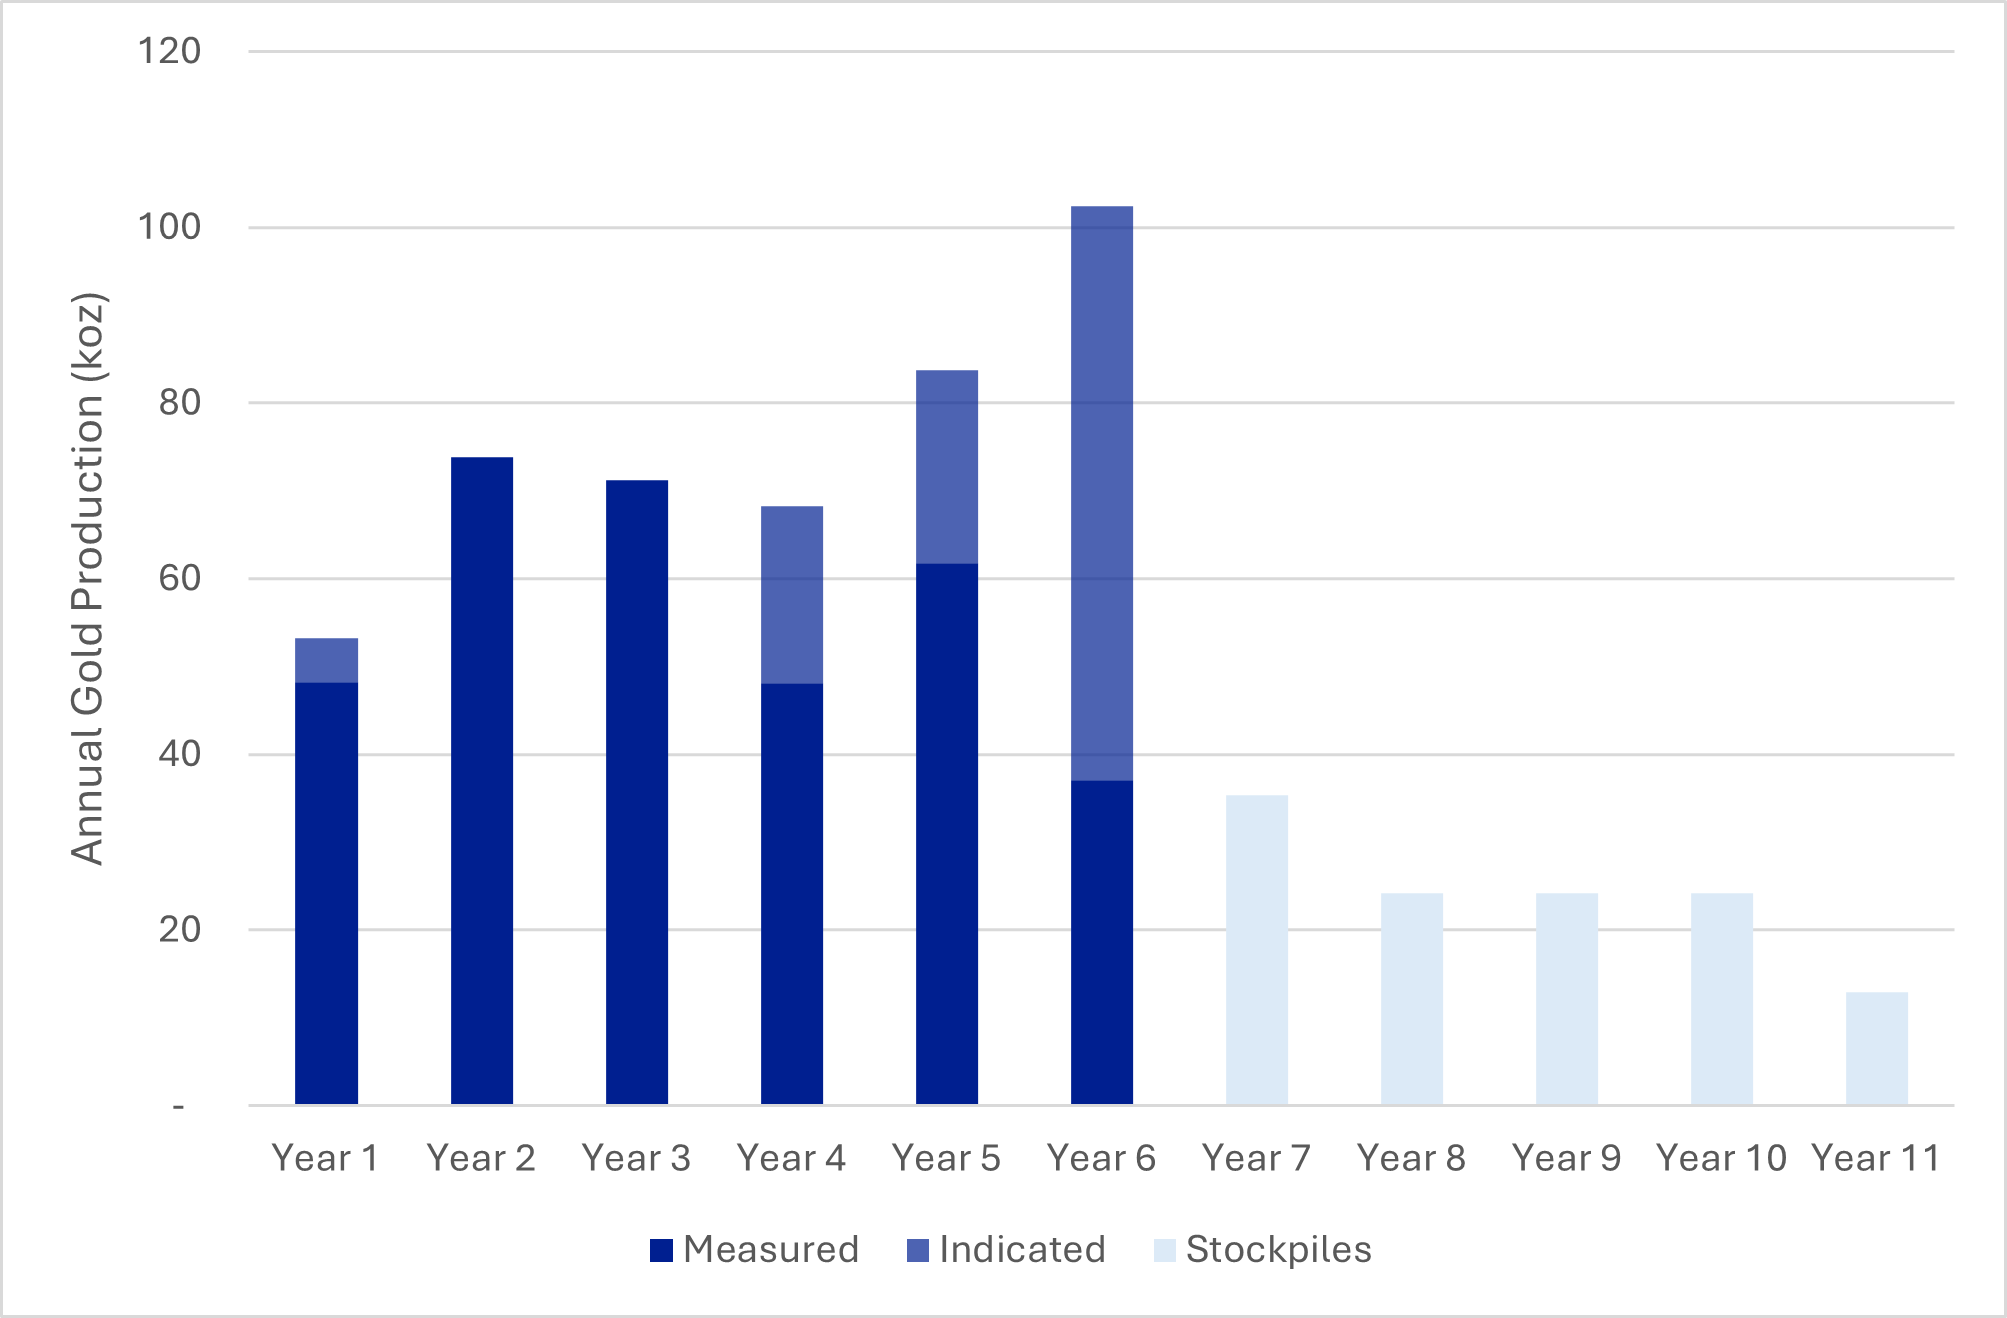
Production Confidence
The Study focusses on the higher confidence Measured and Indicated Mineral Resource, which makes up 100% of the production target.
The Proved Ore Reserve is 14.1Mt at 1.06g/t Au and the Probable Ore Reserve is 6.5Mt @ 0.72g/t Au. Total Ore Reserve ounces are 630koz at an average grade of 0.95g/t Au.
Production Strategy and Detailed Schedule
The production strategy involves prioritising the highest margin accessible material through the processing plant. Key points regarding the mill feed schedule include:
Process plant commissioning and ramp-up occurs in year 1.
Development of the Colosseum north and south open pits is staged to limit capital draw down while maintaining sufficient ore stocks to feed the mill.
Metallurgical recovery averages 91%.
Mining ceases at the end of year 6. A stockpile (11.3Mt) of low grade is processed through to the middle of year 11. Future extensional and regional exploration is expected to extend the period of mining, either via the open pits or an underground development.
Table 2: Colosseum Mine and Processing Production Schedule
Units | Total | Year 0 | Year 1 | Year 2 | Year 3 | Year 4 | Year 5 | Year 6 | Year 7 | Year 8 | Year 9 | Year 10 | Year 11 | |
Mining | ||||||||||||||
North Pit | Kt | 13,027.6 | 188.9 | 3,992.1 | 4,152.6 | 3,470.6 | 1,222.4 | - | - | - | - | - | - | - |
g/t | 0.84 | 0.72 | 0.87 | 0.87 | 0.78 | 0.83 | - | - | - | - | - | - | - | |
Koz | 351.5 | 4.4 | 111.6 | 115.5 | 87.4 | 32.5 | - | - | - | - | - | - | - | |
South Pit | Kt | 7,603.3 | - | 50.4 | 471.5 | 976.8 | 2.227.6 | 2.950.1 | 926.9 | - | - | - | - | - |
g/t | 1.14 | - | 0.47 | 0.59 | 0.69 | 0.85 | 1.28 | 2.19 | - | - | - | - | - | |
Koz | 278.7 | - | 0.7 | 9.0 | 21.8 | 60.7 | 121.1 | 65.4 | - | - | - | - | - | |
Total | Kt | 20.6 | 188.9 | 4,042.5 | 4,624.1 | 4,447.4 | 3,450.0 | 2.950.1 | 926.9 | - | ||||