

par Boron One Holdings Inc. (CVE:BONE)
Boron One Holdings Inc. Announces Positive Preliminary Economic Assessment (PEA) for Its Piskanja Boron Project
VICTORIA, BC / ACCESS Newswire / October 14, 2026 / Boron One Holdings Inc. ("Boron One" or the "Company") (TSXV:BONE), a company committed to advancing global decarbonization through the responsible utilization of its boron assets, is pleased to report positive results of an updated Independent Technical Report and Preliminary Economic Assessment ("PEA") for its wholly-owned Piskanja boron project (the "Project").
The primary reason for the PEA is to present an up-to-date Mineral Resource Estimate (MRE) and Preliminary Economic Analysis (PEA) for the Project that reflect the Company's most current technical studies which were completed subsequent to the Company's previous PEA in 2022. These new studies include: metallurgical and processing testing; a 3D block resource model by borate type; advanced mine designs; geotechnical testing; boron pricing and market dynamics studies; and an environmental study (EIA).
PEA ECONOMIC HIGHLIGHTS (in USD)
| Net Present Value (NPV8) post-tax | $638.8 million |
| Internal Rate of Return (IRR) post-tax | 89.0% |
| Initial capital cost (Capex) w/ contingency | $79.9 million |
| Capex payback from commercial production start | < 12 months |
| Life of Mine (LOM) | 13 years |
| Gross project revenue | $1.97 billion |
| Net project cash flow (post-tax) | $1.16 billion |
| Average annual gross revenue | $140.4 million |
| LOM average annual EBITDA | $87.7 million |
| Net operating margin | 73.0% |
| All in sustaining cost (AISC) per t of Product | $231.44 |
| Weighted average revenue per t of Product | $674.01 |
| LOM Sustaining Capital | $38.1 million |
| LOM average gross production (ROM) | 432.7 ktpa |
| Profitability Index (NPV/Capex) post-tax | 7.99 X |
| LOM Capital Intensity Index (Initial Capex/ROM tonnage) | $14.22 |
| LOM average C1 cost (ROM production) per ton | $89.48 |
| Average annual production (commercial grade) - colemanite | 157.6 ktpa |
| Average annual production (commercial grade) - ulexite | 83.8 ktpa |
| Average annual production of boric acid | 25 ktpa |
| LOM average C1 cost (colemanite) post-tax per ton | $188 |
| LOM average C1 cost (ulexite) post-tax per ton | $188 |
| LOM average C1 cost (boric acid) post-tax per ton | $328 |
| LOM mining gross production (t) | 5.62 million |
| Average grade B2O3 (measured and indicated) | 32.4% |
Note: Units expressed in metric tonnes
MINERAL RESOURCE ESTIMATE
The basis for the PEA is the Mineral Resource Estimate (MRE) prepared by Prof. Miodrag BanjeÅ¡eviÄ PhD. P.Geo, EurGeol. Prof. BanjeÅ¡eviÄ is a Qualified Person in accordance with the CIM Definition Standards on Mineral Resources and Reserves (CIM Standards). The MRE produced by BanjeÅ¡eviÄ is an update to a previous estimate produced by BanjeÅ¡eviÄ in 2022, and SRK Consulting in 2016 (amended in 2019) and reflects a reinterpretation that includes the delineation of geological blocks according to the dominant boron minerals (colemanite, ulexite, howlite) within the outlines of the borate bodies, both horizontally for all 12 borate bodies and vertically for main bodies. The MRE is estimated according to NI 43-101 and CIM Standards.
The updated Mineral Resource Statement generated for the Piskanja Project is as follows:
Mineral Resource Category | Tonnage (t) | BâOâ Grade (%) | Contained B2O3 (t) |
| Measured | 1,049,207 | 34.78 | 364,943 |
| Indicated | 6,090,601 | 31.99 | 1,948,626 |
| Measured + Indicated | 7,139,808 | 32.40 | 2,313,569 |
The updated Mineral Resource Statement by dominant boron minerals is as follows:
Geological Blocks by | CIM / NI 43-101 Mineral Resource | Mineral Resources in tonnes (t) | Weighted Grades (%) | Contained |
| Colemanite (COL) | Measured | 469,619 | 35.52 | 166,824 |
| Indicated | 3,360,829 | 34.14 | 1,147,478 | |
| Measured + Indicated | 3,830,448 | 34.31 | 1,314,302 | |
| Ulexite (ULE) | Measured | 256,795 | 40.47 | 103,923 |
| Indicated | 735,259 | 40.67 | 299,023 | |
| Measured + Indicated | 992,054 | 40.62 | 402,946 | |
| Polymineralic (Mix) | Measured | 322,793 | 29.18 | 94,196 |
| Indicated | 1,994,513 | 25.18 | 502,126 | |
| Measured + Indicated | 2,317,306 | 25.72 | 596,321 | |
| TOTAL | 7,139,808 | 32.40 | 2,313,569 |
The Mineral Resource Statement is reported at a minimum grade threshold of 12 percent B2O3, and considers reasonable underground mining, processing and sales technical parameters. All figures are rounded to reflect the relative accuracy of the estimates. Mineral Resources are not Mineral Reserves and do not have a demonstrated economic viability. The contained B2O3 represents estimated contained metal in the ground and has not been adjusted for metallurgical recovery, and may have discrepancies due to rounding.
PROJECT DESCRIPTION
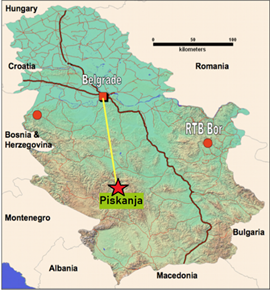
The Project occurs within a 306-hectare exploration licence located in southern Serbia (the Exploration Licence), some 160 km south of the Serbian capital Belgrade by paved road. Balkan Gold d.o.o, which holds the Exploration Licence, is a wholly owned subsidiary of Boron One.
Location of Serbia and the Piskanja boron project
PROJECT GEOLOGY
Geologically, the Project is located within the Jarandol basin, a Neogene continental sedimentary basin positioned in the Vardar Zone (VZ) tectonic belt. The host rocks comprise mudstones, sandstones, carbonates, tuffaceous sediments and conglomerates. It is interpreted that hydrothermal and tectonic activity led to borate mobilisation and deposition as a series of stratiform lenses within the basinal carbonate sediments. Mineralized horizons show a range of textures predominantly comprising different growths of the borate minerals colemanite, ulexite and howlite.
SUMMARY OF PRELIMINARY ECONOMIC ASSESSMENT (PEA)
The PEA was prepared independently, under the supervision of Prof. Miodrag BanjeÅ¡eviÄ PhD. P.Geo, EurGeol, with contributions from Prof. Dejan PetroviÄ PhD (Mining Eng). Prof. PetroviÄ is employed at the Technical Faculty in Bor University of Belgrade as an associate professor in the Department of Underground Exploitation. The PEA was prepared in accordance with the requirements of National Instrument 43-101 and is based on the Mineral Resource Estimate for Piskanja with an effective date of October 12, 2026 (see "Mineral Resource Estimate" above).
PEA ECONOMICS
In summary, the Project has a post-tax Life of Mine (LOM) net project cashflow (pre-finance) of some US$1.16 billion which returns a post-tax NPV (8%) of US$638.8 million and an IRR of 89.0%. The following table presents the summary LOM cash flow resulting from the Technical Economic Model.
Project Cashflow | US$'000 |
Gross Revenue | 1,965,086 |
Deductions | 101,496 |
Net Revenue | 1,863,590 |
Operating Costs | 503,263 |
Project Capital | 79,903 |
Sustaining Capital | 38,059 |
Closure | 15,000 |
Project Cashflow | 1,227,366 |
Working Capital | 0 |
Corporation Tax | 70,020 |
Net Project Cashflow | 1,157,346 |
Project economics were estimated assuming a constant price of US$650/t for sales-grade Colemanite and Ulexite (40% B2O3 purity) and US$1,000/t for technical grade (99.9%) Boric Acid. Capital and operating cost estimates were prepared based on current pricing assumptions and to a PEA level +/- 35% level of accuracy. The PEA presents a complete list of assumptions.
SENSITIVITIES
Discount Rate
The following table shows the pre- and post-tax NPVs at varying discount rates. (USD'000). The base case discount rate of 8% returns a NPV of US$667.1M pre-tax and US$638.9M post-tax.
Discount Rate | Pre-Tax NPV (USD'000) | Post-Tax NPV (USD'000) |
| 5% | 828,431 | 789,104 |
| 8% (Base Case) | 667,135 | 638,893 |
| 10% | 581,579 | 558,798 |
| 12% | 509,633 | 491,176 |
The following table shows the effect on the post-tax NPV8 at varying revenue, opex, capex, and material price levels (from -50% to +50%):
Sensitivities: Post Tax NPV at 8% discount rate
(USD'000,000) | -50% | -40% | -30% | -20% | -10% | 0% | 10% | 20% | 30% | 40% | 50% |
| Revenue | 139 | 239 | 339 | 439 | 539 | 639 | 739 | 839 | 939 | 1,039 | 1,139 |
| OPEX | 768 | 742 | 716 | 690 | 665 | 639 | 613 | 587 | 562 | 536 | 510 |
| CAPEX | 677 | 670 | 662 | 654 | 647 | 639 | 631 | 623 | 616 | 608 | 600 |
| Concentrate price | 178 | 270 | 362 | 454 | 547 | 639 | 731 | 823 | 916 | 1,008 | 1,100 |
| Boric Acid price | 600 | 608 | 615 | 623 | 631 | 639 | 647 | 655 | 662 | 670 | 678 |
The following table illustrates the projected Post-tax Net Present Value ("NPV") sensitivity of the Piskanja project to Operating Cost and Capital Cost variations:
| NPV (USD'000) | OPEX | |||||||||||
| -50% | -40% | -30% | -20% | -10% | 0% | 10% | 20% | 30% | ||||